A Corporate Versus Federal Spending Graphic
Displaying The Corrupting Influence Of Under-Regulated Corporations On America
by Tarry Faster

Recently, I received an article written by one of my favorite trench fighters against corporate tyranny -- Robert Weissman. The article discusses the Supreme Court ruling (Citizens United v. Federal Election Commission) which has flooded the political environment with corporate money/"speech". In the article, he gave a VERY small sampling of the various amounts of money that corporations will have available, relative to our rather insubstantial political processes. Now if you are like me, when we start talking about large amounts of money I normally just notice more zeros and/or lots of words that end with "illion." So, I took some of these recent, source referenced figures and created a graph to give these funds some visual perspective. First, here is the excerpt from his article:
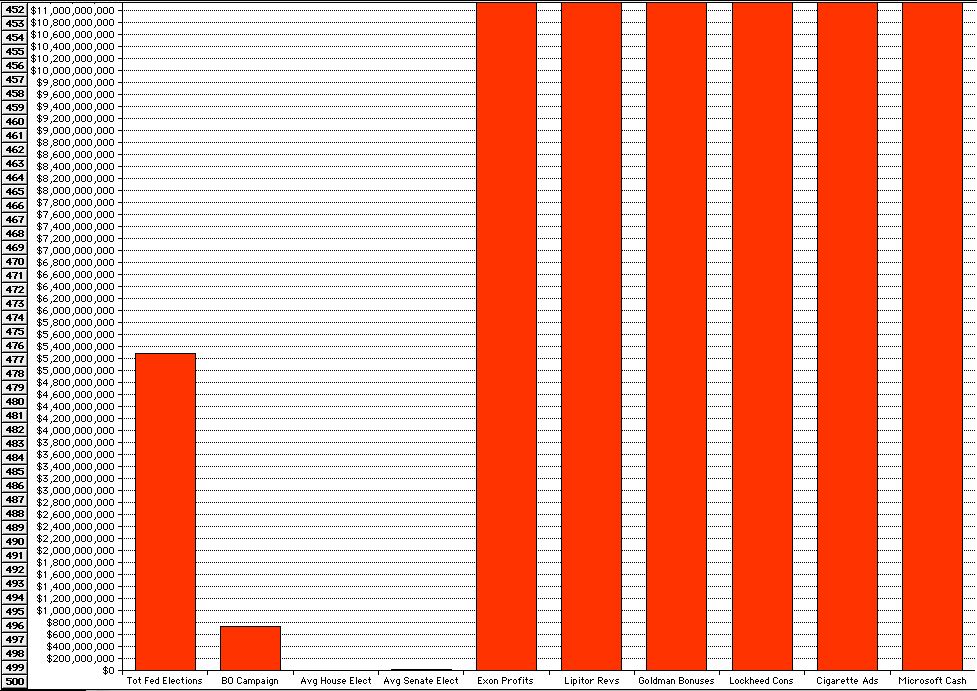
Total amount spent on federal elections in the 2008 election cycle: $5.285 billionAmount spent by Obama campaign in the 2008 election: $730 million
Average amount raised by incumbent Members of the House of Representatives in the 2008 election: $1.356 million (challengers: $335,101)
Average amount raised by incumbent Senators in the 2008 election: $8.741 million (challengers: $1,152,146)
Exxon profits 2007-2008: $85 billion
Top-selling drug, Lipitor, revenues, 2007-2008: $27 billion
Goldman Sachs bonus and compensation expense for 2009: $16.2 billion
Value of Lockheed's defense contracts in 2008: $15 billion
The amount spent on cigarette advertising and promotion by the five largest cigarette companies in the United States in 2006: $12.49 billion
Microsoft cash on hand: $33.4 billion
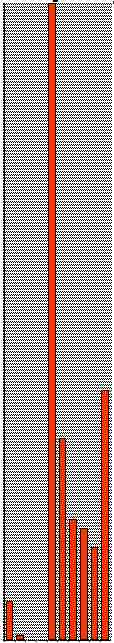
And here is the graph that I created. Notice the the first picture is at full size (100%) and scrolled completely to the bottom of the spreadsheet (line 500 which is maximum spreadsheet size). The Senate spending for elections is a barely visible dark line and the House spending doesn't even show up. To get the full perspective and see the whole chart, I had to reduce it to 12.5% -- which is the second chart. Keep in mind that these are just a few of the corporations that are politically active in the U.S. and that there are currently over 36,000 lobbyist in Washinton D.C.